Blog
How Optim Performance Manager Keeps Your Database Running Smoothly
Optim Performance Manager (OPM) is a tool that helps keep DB2 databases fast, stable, and healthy. Many systems slow down without warning, and this can cause errors, delays, and unhappy users. This is why tools like optim performance manager are used to track performance in real time and stop problems early.
In simple terms, optim performance manager works like a health monitor for your database. It checks how your system is working, finds slow areas, and gives alerts before things break. This helps companies avoid downtime and keep their work running smoothly without interruptions.
Today, in this article, we will understand how optim performance manager works, how it is set up, and why it is so important. We will also look at its main parts, setup steps, and key settings in a very simple way.
What Is Optim Performance Manager?
Optim Performance Manager is an IBM tool used to monitor DB2 database performance. It collects live data from the database and shows how the system is behaving. This helps users understand if everything is running normally or if something is getting slow.
In simple words, optim performance manager watches your database all the time. It does not wait for problems to happen. Instead, it collects performance data continuously and helps detect issues early. This makes database management easier and safer.
This tool is mainly used by database administrators who want full control over system health. It shows important details like query speed, locking issues, and system load. All of this is shown in one easy dashboard.
Why Optim Performance Manager Is Important
Optim performance manager is important because it prevents database problems before they become serious. Many systems fail because performance issues are not noticed early. OPM solves this by giving real-time alerts and updates.
Another reason it is important is that it helps maintain business performance. If a database becomes slow, applications also become slow. This can affect users and even stop important work. OPM helps avoid these situations.
It also supports SLA (Service Level Agreement) goals. Many companies must keep systems fast and reliable. Optim performance manager helps them meet these targets by monitoring performance closely and continuously.
Main Parts of Optim Performance Manager
Optim performance manager has three main parts that work together. The first part is the repository, which stores all performance data. This is where historical data is saved so users can analyze trends and past behavior.
The second part is the web console. This is a simple dashboard that users open in a browser. It shows graphs, alerts, and system status. It is built on WebSphere and makes monitoring easy and visual.
The third part is the data collector or agent. This part runs on the DB2 server. It collects live data from the database and sends it to the repository. Without the agent, optim performance manager cannot monitor anything.
How Optim Performance Manager Works
Optim performance manager works by collecting real-time data from DB2 databases. The agent continuously checks system activity and sends updates to the central repository. This helps create a live picture of database health.
It also compares current performance with normal or past performance. If something changes suddenly, like slow queries or high CPU usage, the system can detect it early. This helps prevent bigger problems.
The system also uses alerts. If performance goes below a safe level, the tool shows warnings in the dashboard. This makes it easier for database teams to act quickly before users are affected.
Optim Performance Manager Setup Requirements
Before setting up optim performance manager, some important requirements must be met. The most important requirement is SYSADM authority. This means the user must have high-level access to manage DB2 settings and start the agent.
This access is needed because the tool must enable monitoring switches and collect deep system data. Without proper permissions, optim performance manager cannot work correctly. So security setup is a very important step.
Another requirement is correct DB2 configuration. The system must allow proper data flow, and monitoring features must be enabled. If these settings are missing, the tool may not collect accurate information.
Important DB2 Settings for OPM
To make optim performance manager work correctly, DB2 must have some important settings enabled. One key setting is AUTO_RUNSTATS = ON. This helps keep database statistics updated, which improves accuracy in performance tracking.
Other settings like DB2_EVALUNCOMMITTED = ON and DB2_SKIPDELETED = ON help improve data handling. These settings make sure the system runs smoothly while collecting performance data.
Memory-related settings like sheapthres = 0 and tuned ASLHEAPSZ also help improve performance. These settings reduce errors and help the system manage resources better during monitoring.
Step 1: Opening the Optim Performance Manager Console
To start using optim performance manager, the first step is to open the web console. This console runs on WebSphere and can be accessed through a browser using a special URL given during installation.
After opening the console, users must log in using their credentials. These credentials are created during setup. Once logged in, users will see a dashboard that shows system options and monitoring tools.
The console is the main control center of optim performance manager. From here, users can add databases, configure settings, and check performance data in real time.
Step 2: Adding a Database for Monitoring
After logging in, the next step is to add a database for monitoring. This is done using the task launcher option inside the console. The user selects “Add and configure database for monitoring” to start setup.
In this step, users must enter database details like hostname, port number, database name, and monitoring user ID. The user must also have SYSADM authority to ensure full access.
Once the details are added, the system connects the database with optim performance manager. This allows the tool to start collecting performance data from that specific database.
Step 3: Setting Monitoring Options
After adding the database, users must configure monitoring settings. These settings decide how the system collects and stores data. One important option is the collection interval, which controls how often data is collected.
Another setting is the monitoring level. This defines how detailed the data will be. Higher levels give more information but also use more system resources. Users must choose carefully based on system needs.
The last setting is data retention time. This decides how long performance data will be stored in the repository. Longer storage helps with deeper analysis of past performance trends.
Step 4: Setting Up the Data Collector (Agent)
The data collector, also called the agent, is a very important part of optim performance manager. It runs directly on the DB2 server and collects live performance data from the database. This data is then sent back to the central repository for analysis and monitoring.
To set up the agent, a configuration command is used. The user must run a script like Db2-agent.sh config instance_name. This step tells the system which DB2 instance will be monitored. It is very important that the instance name matches exactly.
After configuration, the next step is to start the agent. This is done using Db2-agent.sh start instance_name. Once it starts, it begins collecting real-time data. Without this agent, optim performance manager cannot monitor anything properly.
The agent must be started with SYSADM authority. This is needed so it can turn on monitoring switches and access deep system data. If permissions are missing, data collection may fail or stop working.
Step 5: Checking Database Health Status
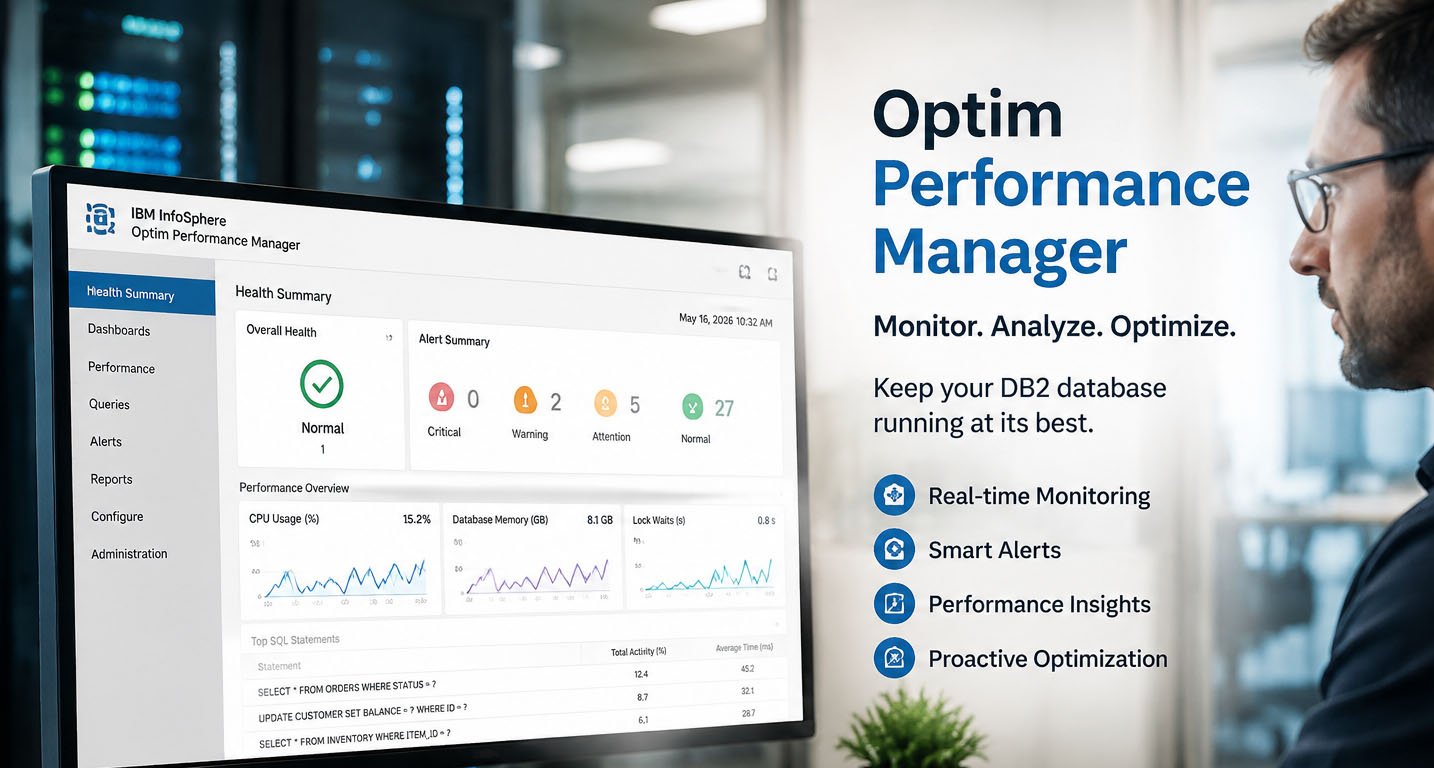
After the setup is complete, the next step is to check if everything is working. This is done in the optim performance manager web console using the Health Summary dashboard. It shows if the database is running normally or not.
In this dashboard, one key indicator is the alert status. If everything is fine, the status will show “Normal.” If there are issues, it may show “Warning” or “Alarm.” This helps users quickly understand system health.
Another important check is the timestamp. The system should show a recent and updating time. This means that the agent is sending live data correctly to the repository.
If both the status and timestamp are correct, it means optim performance manager is working properly. The database is now being monitored in real time without any issues.
Common Problems and Easy Fixes
Sometimes users face issues while using optim performance manager. One common problem is missing SYSADM authority. If the user does not have proper access, the agent will not start or collect data.
Another common issue is a mismatch in the instance name. If the DB2 instance name does not match the configuration, the system cannot link the data correctly. This leads to missing or incorrect monitoring results.
Sometimes the dashboard does not show updated data. This usually means the agent is not running or the connection between the database and repository is broken. Restarting the agent can often fix this problem.
There can also be repository connection issues. These happen when network settings or database links are not properly configured. Checking connection details usually solves this issue.
Extended Insight Feature (Advanced Monitoring)
Optim performance manager also has an advanced feature called Extended Insight. This feature helps track the full path of application requests from start to finish. It gives deeper visibility into system performance.
With Extended Insight, users can see how applications interact with the database. This helps identify delays not only in the database but also in the full application flow. It is very useful for large systems.
However, this feature requires a special license. In some cases, users must activate it using an additional activation kit. Without it, Extended Insight will not work.
This feature is especially helpful for advanced performance analysis. It gives a complete picture of system behavior, which helps improve optimization and troubleshooting.
Final Thoughts
Optim performance manager is a powerful tool that helps keep DB2 databases fast and stable. It works by collecting real-time data, analyzing performance, and alerting users before problems become serious.
The setup process may look technical, but it becomes simple when broken into steps. You need correct permissions, proper DB2 settings, and a properly configured agent to make everything work smoothly.
Once everything is running, users can easily monitor database health from one dashboard. This helps reduce downtime, improve performance, and support better decision-making.
In short, optim performance manager is not just a monitoring tool. It is a complete system that helps ensure databases run smoothly, safely, and without interruption.
Don’t miss these:
Microwey Explained: The Easy Way to Cook Faster and Smarter at Home
Pellela Meaning Explained: A Simple Guide to Its Hidden Story and Origins

Why Everyone Is Talking About Kuarden Coin in 2026

How Optim Performance Manager Keeps Your Database Running Smoothly

Hsnime Explained: What Anime Fans Need to Know in 2026

Ecryptobit.com Review: Is This NFT Platform Really Worth Using?

Warmup Cache Request Explained: How Websites Stay Fast After Updates

Ace Ultra Premium Mystery: Premium Vape or Market Scam? Full Facts Explained

How NSCorp Mainframe Works Behind the Scenes of Train Operations

The Architect in London I Hired Started by Telling Me What Not to Build

Global Events and Everyday Finances: Finding Calm in Modest Borrowing Choices

7 Workplace Conflicts That Can Destroy Team Performance

Dale Russell Gudegast Biography: All You Should Know About Eric Braeden’s Wife

Voomixi com in 2026: What It Is, How It Works, and Why People Search for It

Understanding Project Compliance Through PMP Principles

What Is Sotwe? Everything You Need to Know Before Using It

Vidmud AI Photo Editor Online Review: Smart Photo Enhancements Without Sign-Up

Anthony McClelland and LeBron James: A Father-Son Story Few Know About

Peta Gibb’s Story: The Full Life of Andy Gibb’s Only Daughter

Ria Sommerfeld: Everything to Know About Tom Kaulitz’s Former Wife

Fast Secure VPN for Internet : Free Download iTop VPN

Why Higgsfield AI Image Generator Is Becoming the Default Tool for Gaming Brands Producing Launch Visuals Fast
Why Everyone Is Talking About Kuarden Coin in 2026
How Optim Performance Manager Keeps Your Database Running Smoothly
Hsnime Explained: What Anime Fans Need to Know in 2026
Ecryptobit.com Review: Is This NFT Platform Really Worth Using?
Warmup Cache Request Explained: How Websites Stay Fast After Updates
Ace Ultra Premium Mystery: Premium Vape or Market Scam? Full Facts Explained
How NSCorp Mainframe Works Behind the Scenes of Train Operations
The Architect in London I Hired Started by Telling Me What Not to Build
Global Events and Everyday Finances: Finding Calm in Modest Borrowing Choices
7 Workplace Conflicts That Can Destroy Team Performance
-

 Biography3 months ago
The Emotional Journey of Joanne Schieble Simpson, Steve Jobs’ Biological Mother
-

 News3 months ago
Jamal Adeen Thomas – Everything You Should Know About Clarence Thomas’ Son
-

 Biography3 months ago
Meet Theo Ressler: Everything You Know About Jami Gertz’s son
-

 Tech2 months ago
Bynethi com Explained Clearly: Benefits, Risks, and What to Expect